simple tables in a web app using flask and pandas with Python
Display pandas dataframes clearly and interactively in a web app using Flask.
Web apps are a great way to show your data to a larger audience. Simple tables can be a good place to start. Imagine we want to list all the details of local surfers, split by gender. This translates to a couple of pandas dataframes to display, such as the dataframe females below.
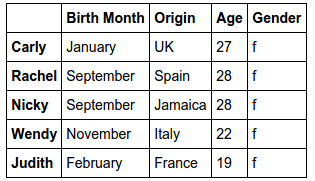
Transforming dataframes into html tables
Using the pandas function to_html we can transform a pandas dataframe into a html table. All tables have the class dataframe by default. We can add on more classes using the classes parameter. For example, writing
females.head(1).to_html(classes='female')
results in a html table with the classes dataframe female as shown below.

Prepare the file structure for flask app
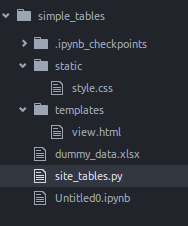
The simple_tables directory will contains all the scripts, css and html needed for the web app to run. The script site_tables.py will sit in this directory, and from here we will run the app and populate the app’s pages. Any html templates must be stored in the templates directory. Any css sheets must be within the static directory.
Below is the file structure I have used for this surfing example.
Create a flask app that pulls the dataframes
We can create a page on our web app called tables. Every time this page loads, we pull the data, filter and format to get two dataframes, females and males.
The dataframes are then transformed into html tables with classes dataframe female and dataframe male respectively. These html tables are sent as a list to the template view.html, which is stored in the templates directory. We also send a list of titles to use as a heading for each table.
Running the app using debug=True allows the app to auto-update every time the code gets edited.
from flask import *
import pandas as pd
app = Flask(__name__)

@app.route("/tables")
def show_tables():
    data = pd.read_excel('dummy_data.xlsx')
    data.set_index(['Name'], inplace=True)
    data.index.name=None
    females = data.loc[data.Gender=='f']
    males = data.loc[data.Gender=='m']
    return render_template('view.html',tables=[females.to_html(classes='female'), males.to_html(classes='male')],
    titles = ['na', 'Female surfers', 'Male surfers'])

if __name__ == "__main__":
    app.run(debug=True)
Define the html template using jinja2
The html template view.html pulls css from the style sheet style.css in the static directory. We will check out the css in the next section.
Next, the jinja2 language allows us to loop through the html table list tables. Using loop.index provides the index of the loop. This starts from 1 so we need to convert between python list indices and those for jinja2 loops. Then we can pull out the correct title for each table.
For each table in the list, the table title is shown, and then the table itself. safe tells jinja2 to show this parameter as a html object.
<!doctype html>
<title>Simple tables</title>
<link rel=stylesheet type=text/css href="{{ url_for('static', filename='style.css') }}">
<div class=page>
  <h1>Surfer groups</h1>
  {% for table in tables %}
    <h2>{{titles[loop.index]}}</h2>
    {{ table|safe }}
  {% endfor %}
</div>
Style the tables with css
We can use the following styling to make the tables a bit more pretty. The classes male and female have been defined with different header colours. This enables us to highlight different groups of tabled data from the initial site_tables.py script.
Some nice touches include using tr:nth-child(odd) and tr:nth-child(even) to have alternate row colours. Also tr:hover gives an interactive feel to the tables.
body            { font-family: "Lucida Sans Unicode", "Lucida Grande", sans-serif;}
a, h1, h2       { color: #377ba8; }
h1, h2          { margin: 0; }
h1              { border-bottom: 2px solid #eee; }
h2              { font-size: 1.2em; }

table.dataframe, .dataframe th, .dataframe td {
  border: none;
  border-bottom: 1px solid #C8C8C8;
  border-collapse: collapse;
  text-align:left;
  padding: 10px;
  margin-bottom: 40px;
  font-size: 0.9em;
}

.male th {
    background-color: #add8e6;
    color: white;
}

.female th {
    background-color: #77dd77;
    color: white;
}

tr:nth-child(odd)		{ background-color:#eee; }
tr:nth-child(even)	{ background-color:#fff; }

tr:hover            { background-color: #ffff99;}
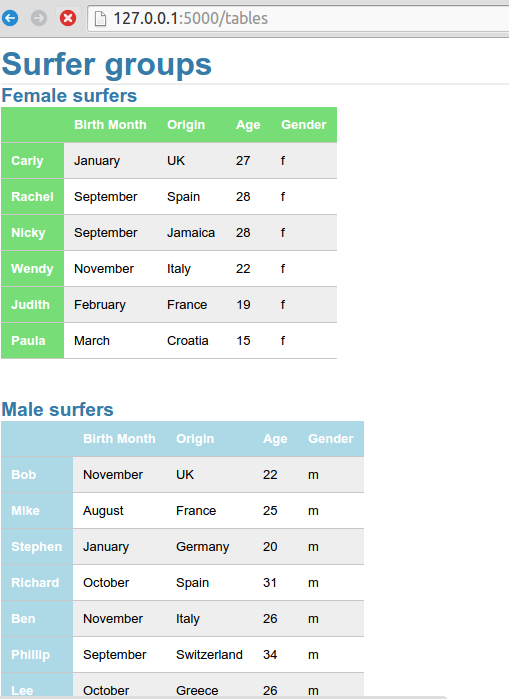
View the web app
Running the script site_tables.py from bash will serve the web app on your local host. Your web page should look like the one below.
Feedback
Always feel free to get in touch with other solutions, general thoughts or questions.