frequency of a variable per column with R
Count the number of times a certain value occurs in each column of a data frame.
Imagine a set of columns that work like a set of tick boxes, for each row they can show true or false, 0 or 1, cat or dog or zebra etc. This sounds simple but I tore my hair out trying to find a solution!
Data Sample
Suppose we have a sample of lunch box orders. Every row represents an order, and each column represents a lunch item that can be chosen or not chosen.
#data frame filled with lunch box orders
lunch.box.df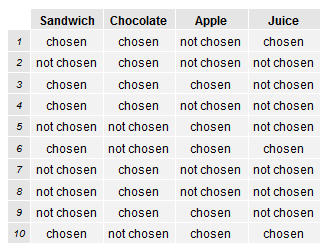
Solution
Using the ldply function we are able to count how many times a certain value appears per column. This can be an factor, integer or a string.
#count number of chosen's in each column
library(plyr)
count.chosens.per.column <- ldply(lunch.box.df, function(c) sum(c=="chosen"))

#giving us the following
count.chosens.per.column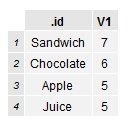
Visualised Result
To finish up, we can now plot a simple bar chart of occurences per column.
#plot bar chart of variable frequencies per column
library(ggplot2)
chosen.per.lunch.item <-
  ggplot(count.chosens.per.column, aes(x=.id, y=V1)) +
  geom_bar(stat="identity", colour="black", fill="white") +
  xlab("") + ylab("")

#giving us the following plot
chosen.per.lunch.item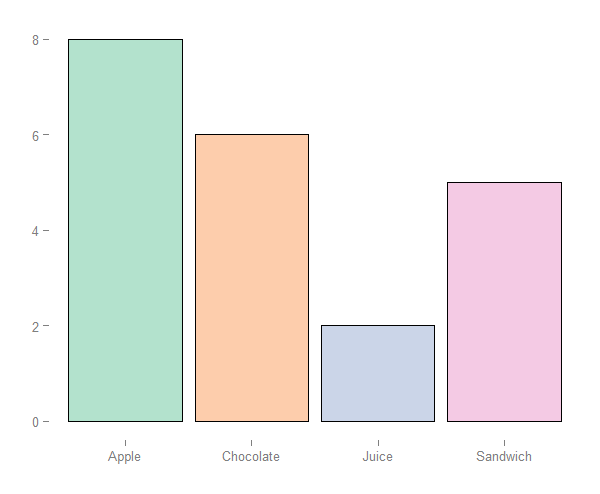
Feedback
Always feel free to get in touch with other solutions, general thoughts or questions.