plotting beautiful clear maps with R
Plotting a world map and stripping away all the noise to achieve a clear and simple result.
Get world map data
The map_data function gives a data frame filled with border points of each country, in latitude and longitude units.
#Get the world map country border points
library(maps)
library(ggplot2)
world_map <- map_data("world")
To demonstrate the structure of the world_map data frame, let’s look at the entries for two small countries.
#Look at data for Switzerland and Malta
Switzerland <- subset(world_map, world_map$region=="Switzerland")
Malta <- subset(world_map, world_map$region=="Malta")

Switzerland
Malta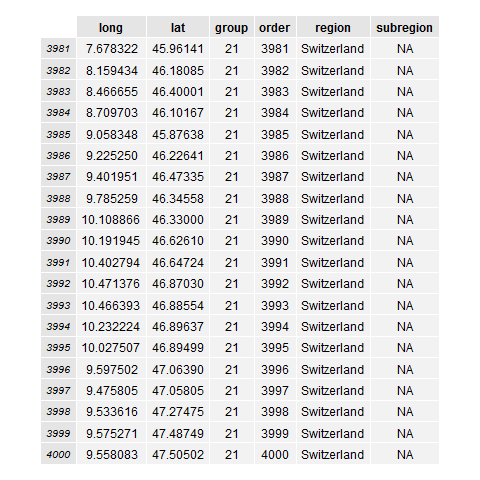
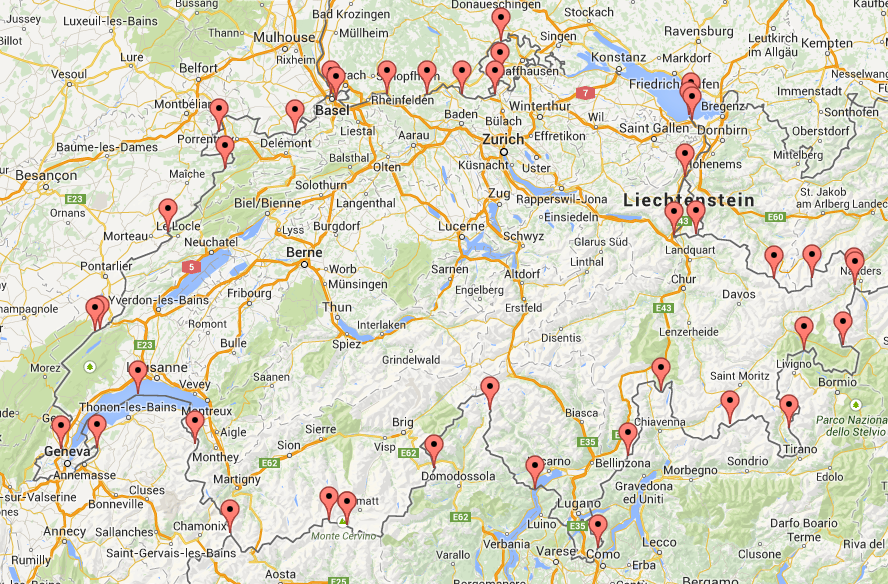
For Switzerland we can see the border long & lat location points, and in what order to join them together. Also Switzerland is grouped as 21. Plotting these location points on a map using an online tool, you can see how they follow the Swiss border.
Now let’s see what Malta looks like.
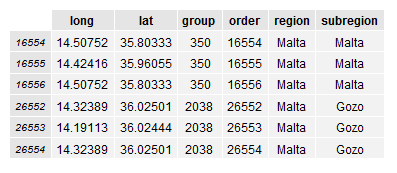
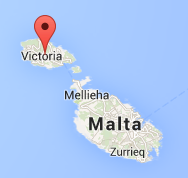
For Malta we also see that there are two subregions, Malta and Gozo, which are grouped under 350 and 2038 respectively. This subregion is necessary because Gozo is a seperate island from Malta. The map below marks Gozo, an island of Malta.
Plot the world map
The geom_polygon function joins up the country border points, and fills in the countries.
#Creat a base plot with gpplot2
p <- ggplot() + coord_fixed() +
  xlab("") + ylab("")

#Add map to base plot
base_world_messy <- p + geom_polygon(data=world_map, aes(x=long, y=lat, group=group),
                               colour="light green", fill="light green")

base_world_messy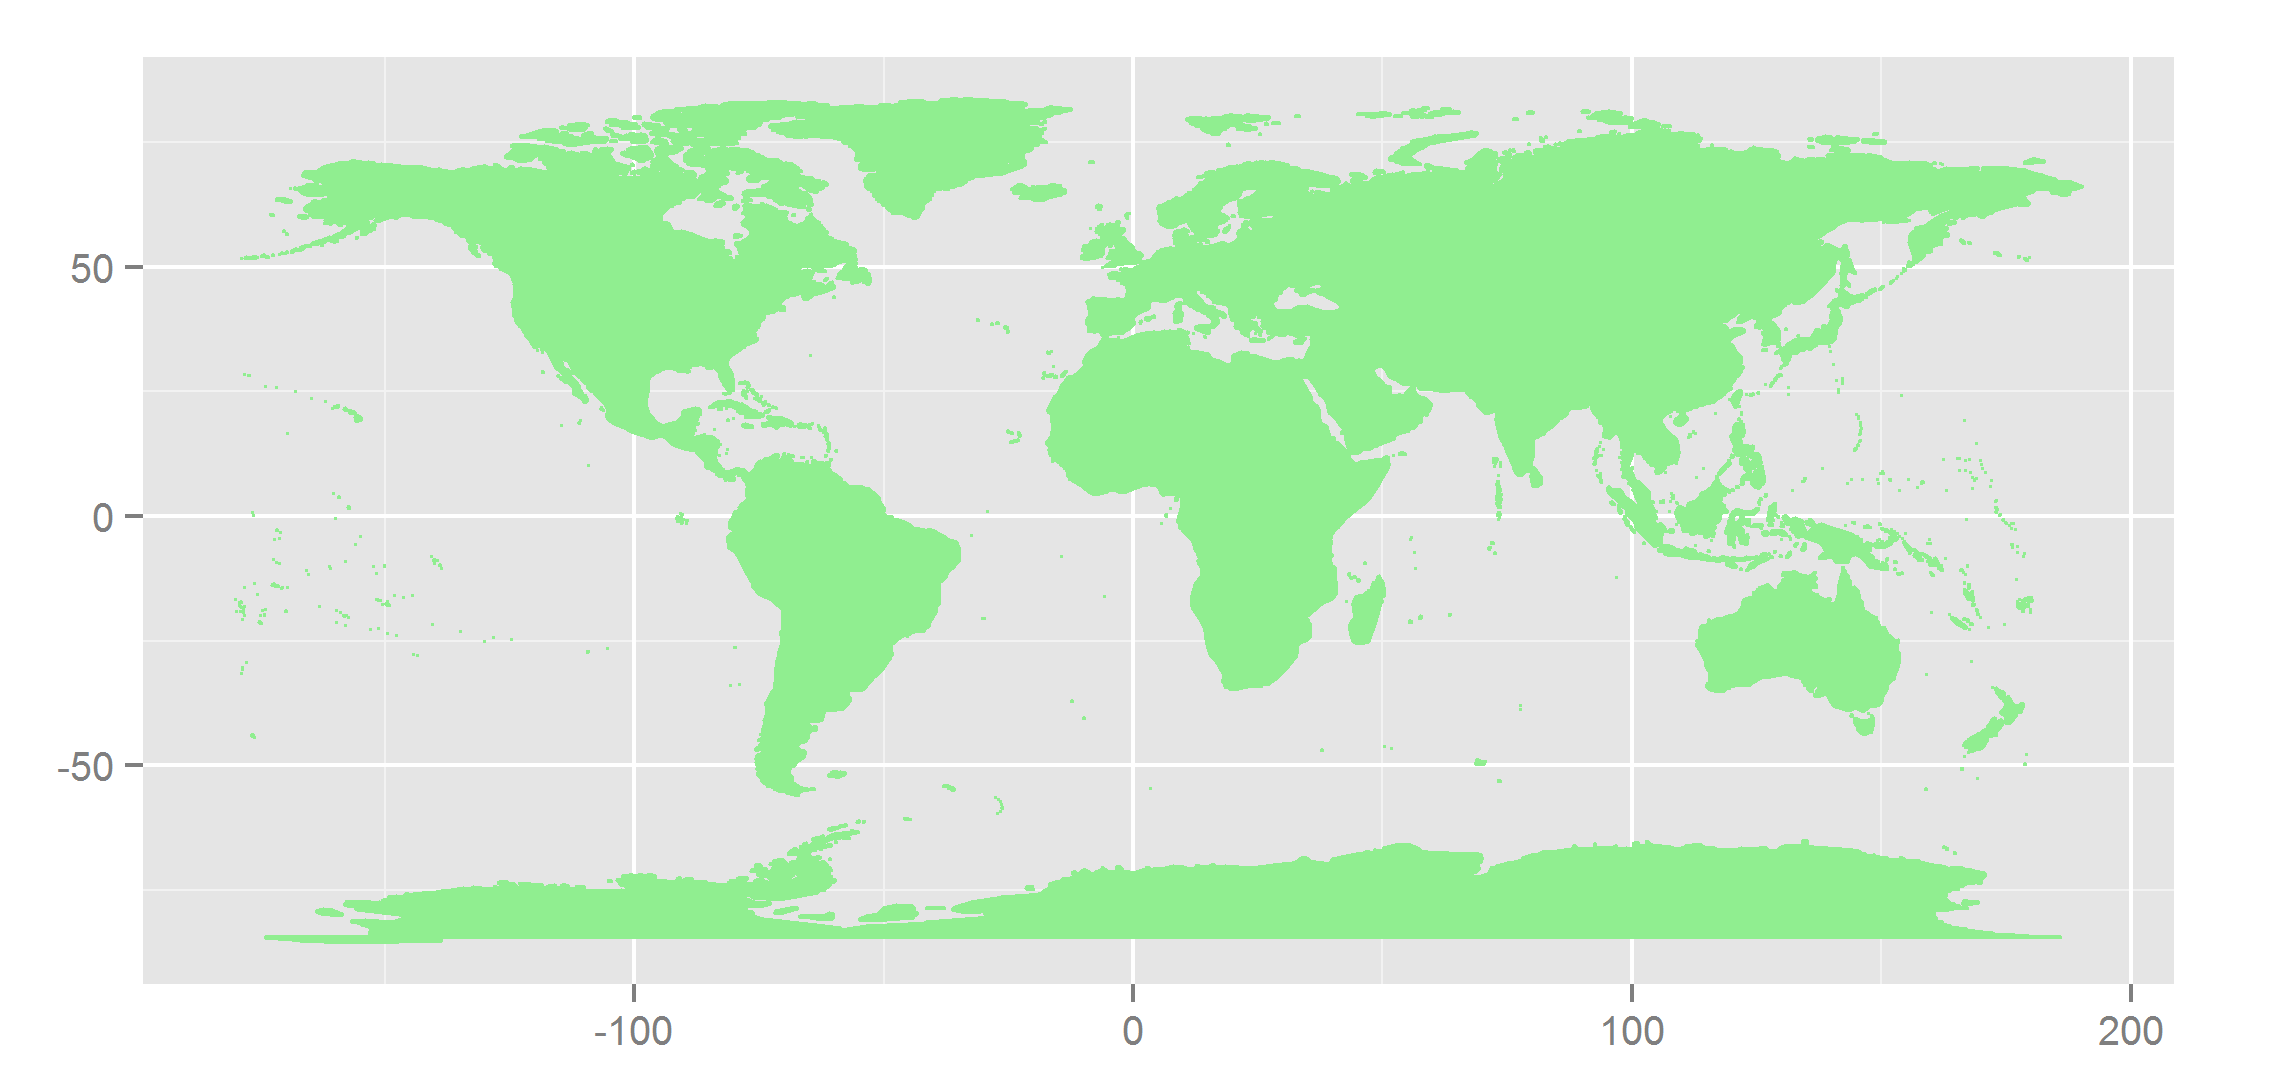
The light green fill colour already has a big impact on how calm and clear the map looks.
Strip down the world map
The theme function lets you remove the background grid and the axes.
#Strip the map down so it looks super clean (and beautiful!)
cleanup <-
  theme(panel.grid.major = element_blank(), panel.grid.minor = element_blank(),
        panel.background = element_rect(fill = 'white', colour = 'white'),
        axis.line = element_line(colour = "white"), legend.position="none",
        axis.ticks=element_blank(), axis.text.x=element_blank(),
        axis.text.y=element_blank())

base_world <- base_world_messy + cleanup

base_world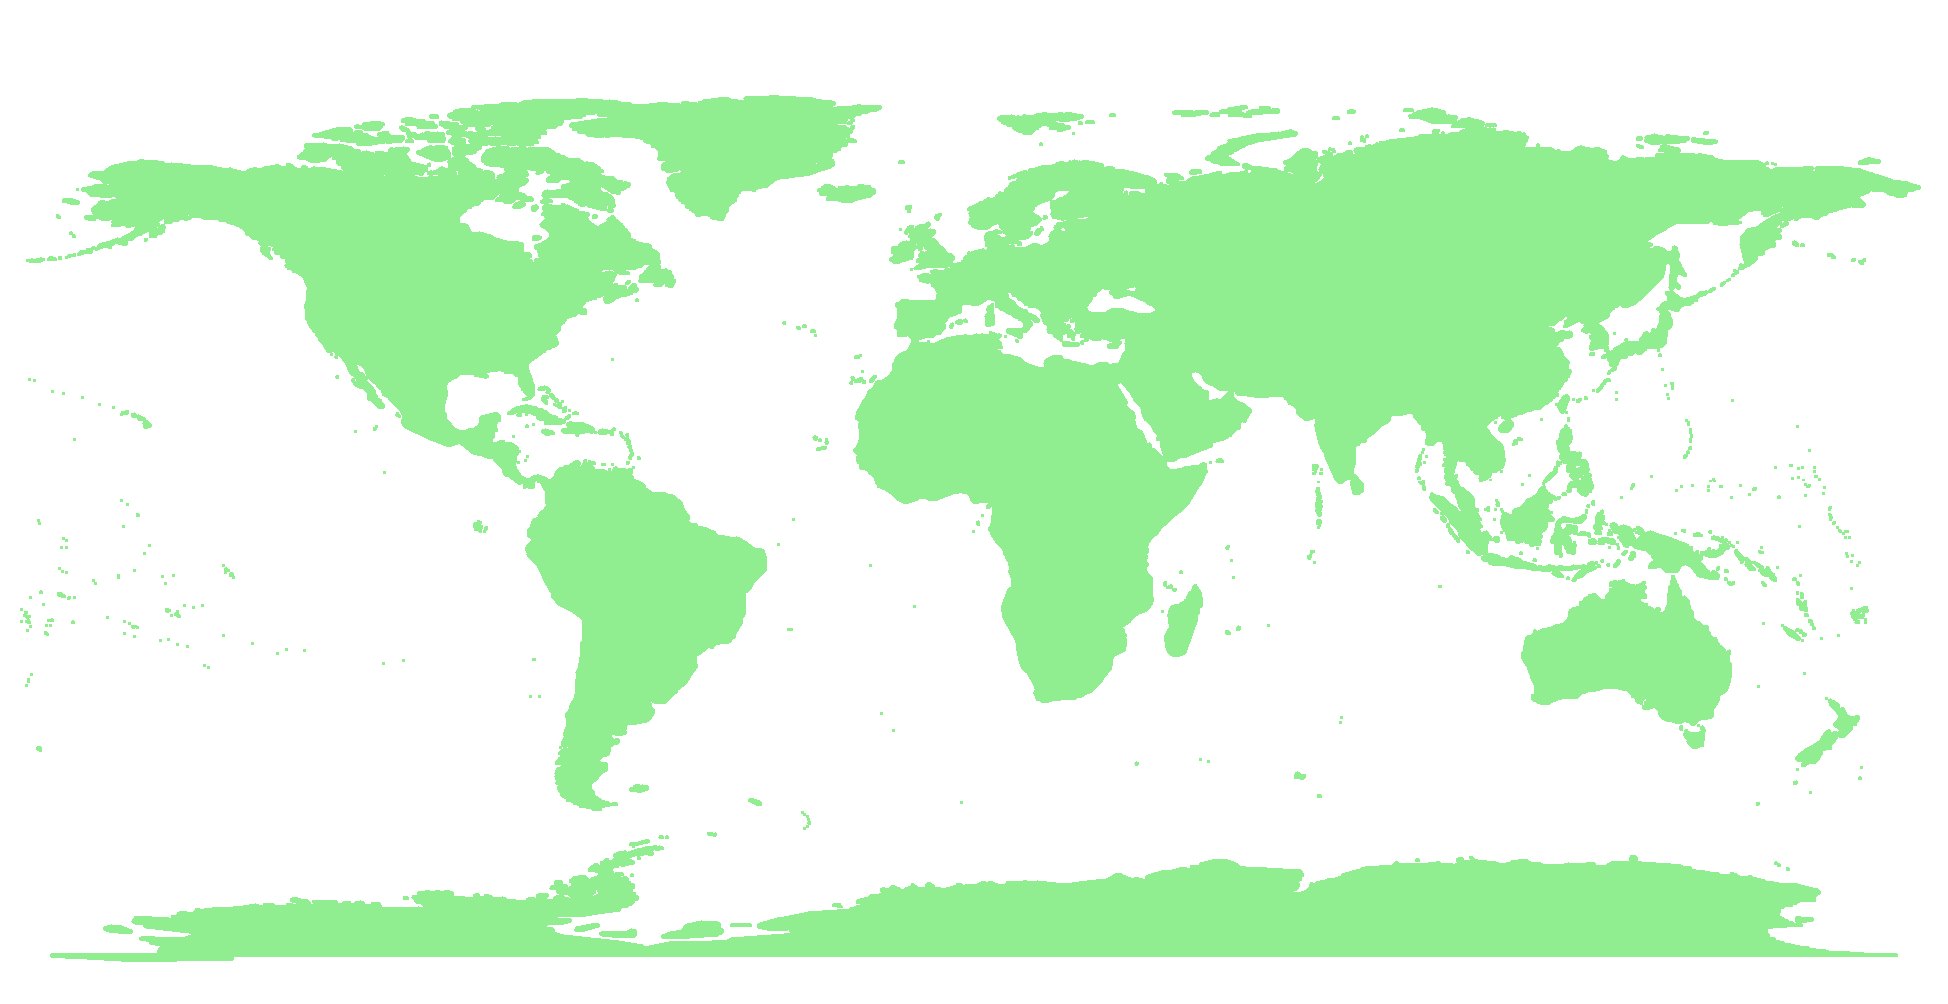
Feedback
Always feel free to get in touch with other solutions, general thoughts or questions.