do first babies arrive late? - with Python
Working through thinkstats by Allen B Downey to figure out if the myth is true - that first babies are born late.
We can analyse the data from National Survey of Family Growth, conducted by the US. Centers for Disease Control and Prevention. This is a cross-sectional study - data was collected from a sample representing the population, at a particular point in time.
Find an Apparent Effect
We find that the difference in average pregnancy duration, between first and not-first babies, is 13 hours.
Apparent Finding 1: First born babies are born, on average, 13 hours later than other babies
This is an apparent effect, because we don’t know if something is actuallly signified by these results.
To figure out if something is actually being signified, we should try and answer the following questions:
- Can we be more precise about how the groups differ?
- Could the difference have occured by chance?
- Could the difference be due to experimental setup?
1. Can we be more precise? - Descriptive stats
Standard Deviation
The standard deviation of the duration for first babies is 2.8 weeks. For not first babies it is 2.6 weeks.
So there appears to be more variation in duration length for first babies.
Descriptive Finding 1: First born babies have more variation in pregnany duration
The difference in standard deviation is 0.2 weeks.
The difference in means is 0.08 weeks.
Since the difference in mean is less than the standard deviation, this could suggest that the difference in mean is not statistically significant.
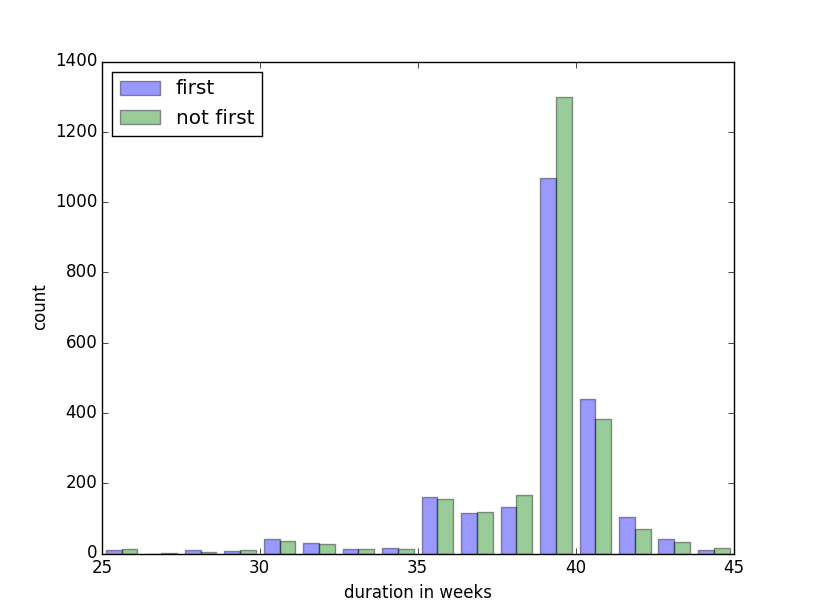
Histogram
The histogram we plot gives an overview of the data. The sample size of first and not first babies isn’t equal - so we shouldn’t rely on the historgram much at all.
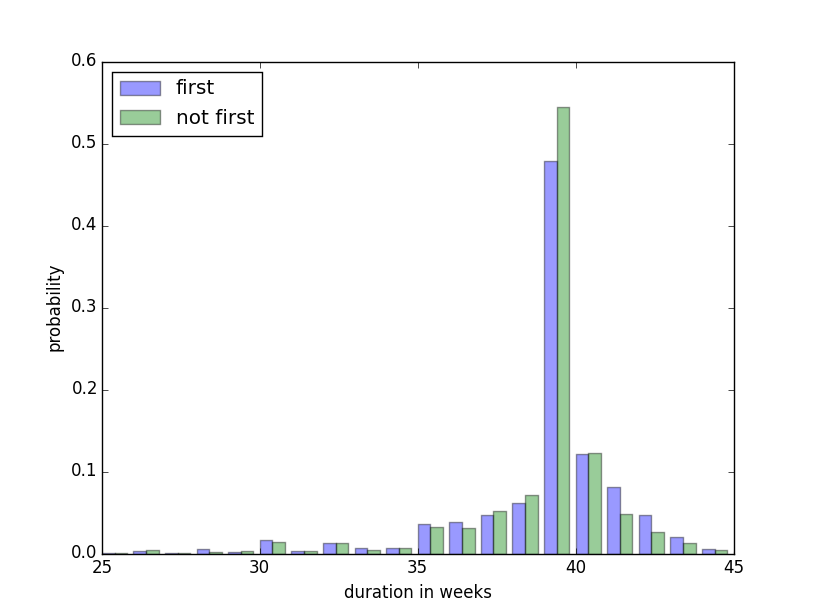
Probability Mass Function
The Probability Mass Function (PMF) shows the probability distribution for each sample. Each distribution adds up to 1.
We can see that first babies are less likely to be born in week 39 and are more likely to be born in weeks 41 and 42.
Descriptive Finding 2: First born babies seem less likely to arrive in week 39
Descriptive Finding 3: First born babies seem more likely to arrive in weeks 41 and 42
Relative Risk
We define being born:
- early - as being born before Week 38
- on time - as being born during week 38, 39, 40
- late - as being born after week 40
We can calculate the probability for early, on time and late babies. We can find this probability for first and not first born babies.
For first born babies, the probability of each is as follows: early 18.2%, on time 66.2%, late 15.5%
For not first born babies, we get: early 16.8%, on time 73.8%, late 9.4%
The relative risk is the rato of two probabilities. To get the relative risk of a first born arriving early, we calculate probability(early first born) / probability(early not first born).
The relative risk of a first born being early is 18.2 / 16.8 = 1.08. The relative risk of a first born being late is 1.66.
Descriptive Finding 4: Early first babies are 8% more likely than other babies
Descriptive Finding 5: Late first babies are 66% more likely than other babies
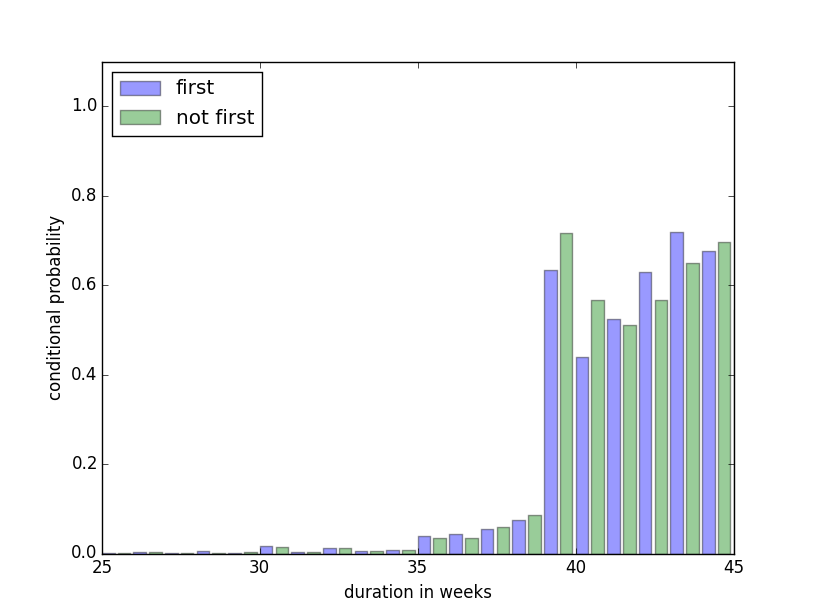
Conditional Probability
We can calculate the probability that a baby will be born in week x given that it was not born before week x. The plot below shows this probability for first and not first babies, for every week x.
Summary of Descriptive Findings
- First born babies have more variation in pregnany duration
- First born babies seem less likely to arrive in week 39
- First born babies seem more likely to arrive in weeks 41 and 42
- Early first babies are 8% more likely than other babies
- Late first babies are 66% more likely than other babies
2. Could the difference have occured by chance?
Answer coming soon…
Feedback
Always feel free to get in touch with other solutions, general thoughts or questions.