plotting data points on maps with R
Plotting data points onto a world map, with point adjustments according to additional variables.
The data to plot
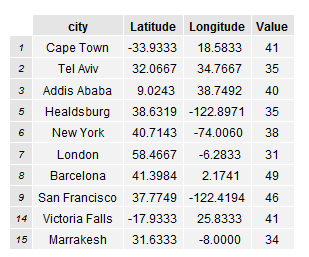
For certain cities, the sample contains longitude, latitude and a random variable. Below are a few rows of the data.
#table of cities with latitude, longitude, and variable
cities
Simple plot of data points
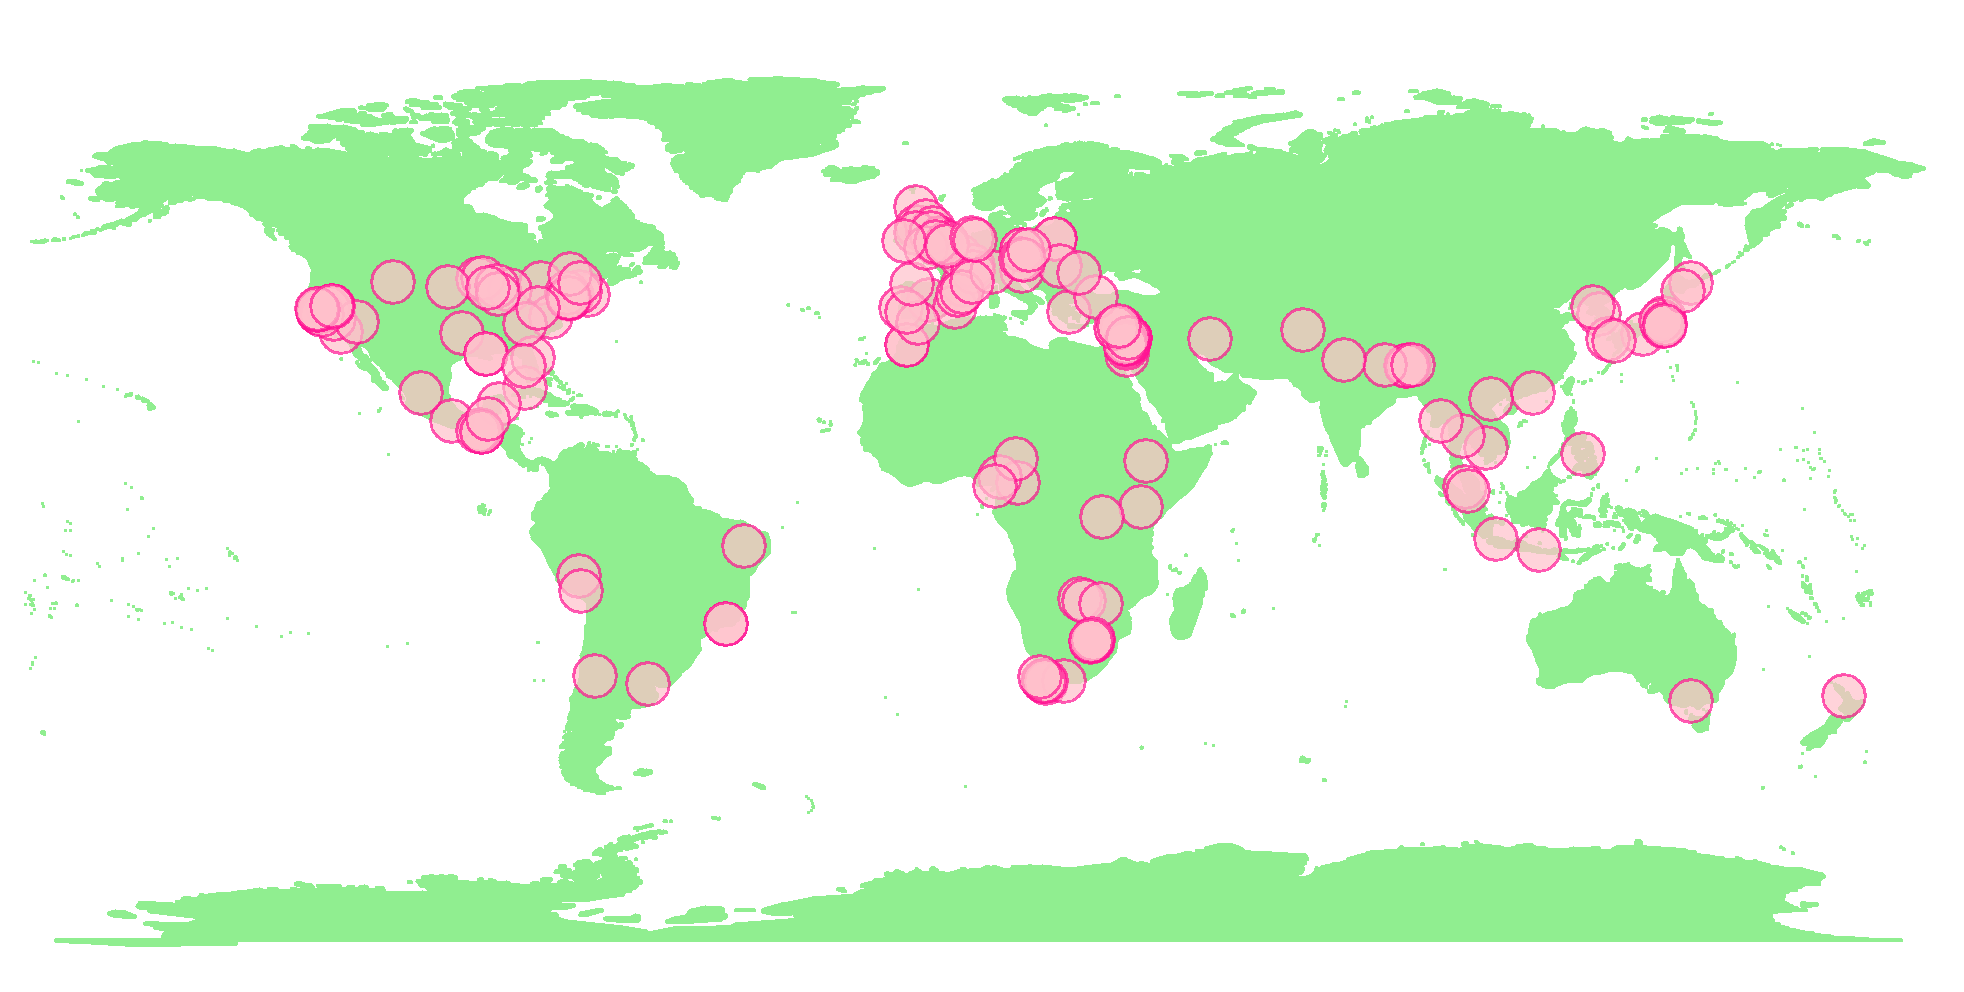
The geom_point function plots points on the base map plot. The base map plot base_world was created in a previous post - plotting beautiful clear maps with R.
The pch function let’s us define an outline and inner fill for each point. If you play with this number, you get different shaped points.
The alpha function is for plot transparency.
#Add simple data points to map
map_data <-
  base_world +
  geom_point(data=cities,
             aes(x=Longitude, y=Latitude), colour="Deep Pink",
             fill="Pink",pch=21, size=5, alpha=I(0.7))

map_data
Vary size of data points
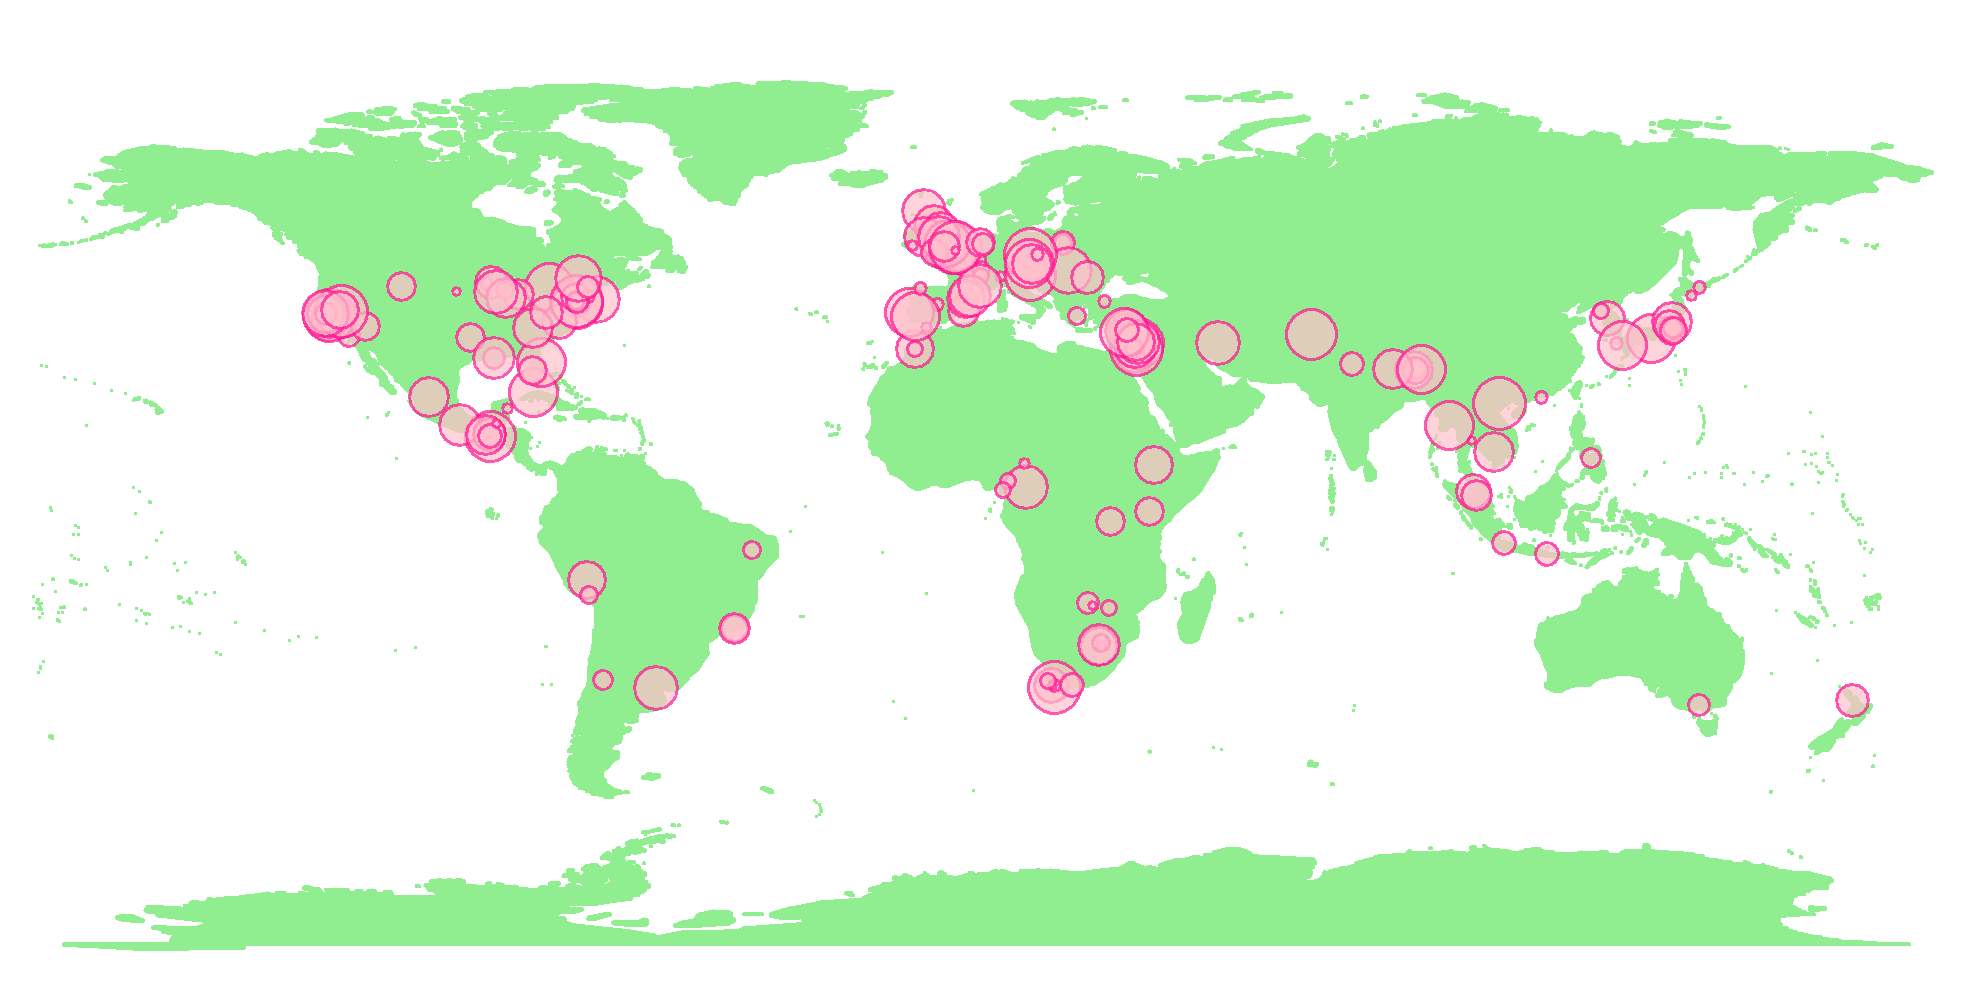
Setting size equal to a variable, within aes, results in point sizes that vary according to the variable.
You can add legend.position=”none” to remove the legend (this was already included for the base_world plot).
#Add data points to map with value affecting size
map_data_sized <-
  base_world +
  geom_point(data=cities,
             aes(x=Longitude, y=Latitude, size=Value), colour="Deep Pink",
             fill="Pink",pch=21, alpha=I(0.7))

map_data_sized
Vary colour of data points
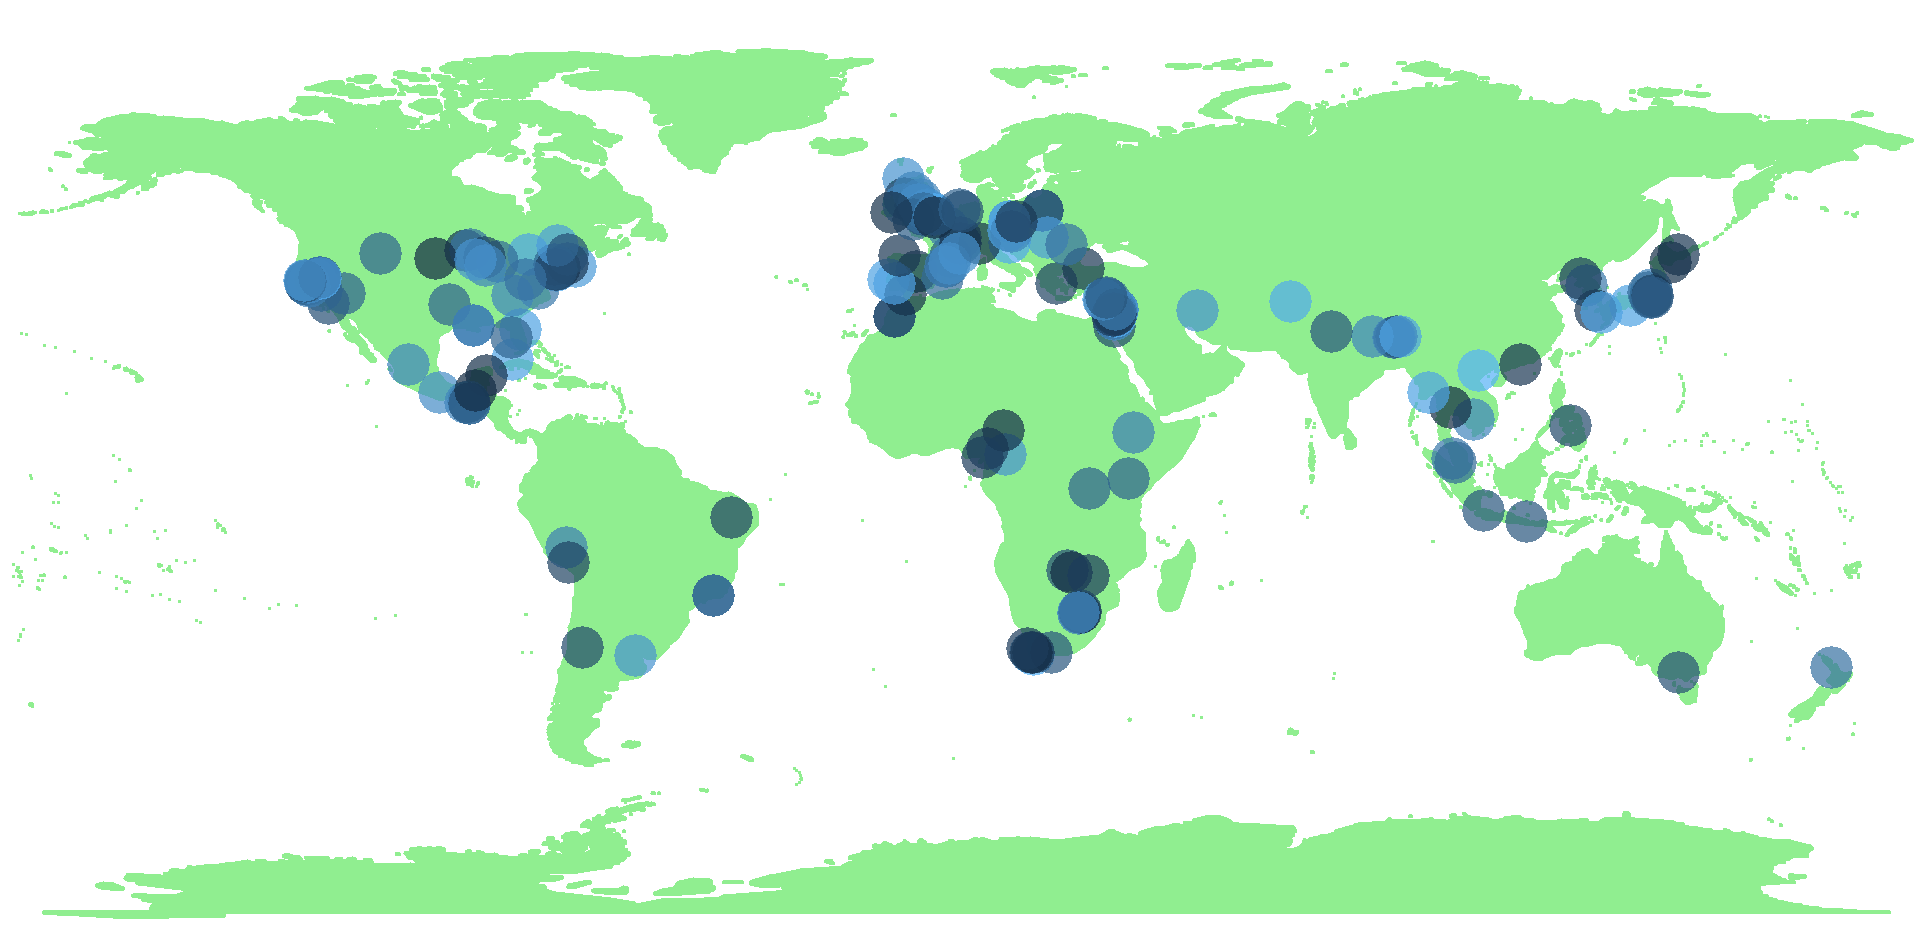
Setting colour equal to a variable, within aes, results in point colours that vary according to the variable. You can use scale_colour_manual() or scale_colour_brewer() to alter colours.
You can again add legend.position=”none” to remove the legend (this was already included for the base_world plot).
#Add data points to map with value affecting colour
map_data_coloured <-
  base_world +
  geom_point(data=cities,
             aes(x=Longitude, y=Latitude, colour=Value), size=5, alpha=I(0.7))

map_data_coloured
Feedback
Always feel free to get in touch with other solutions, general thoughts or questions.